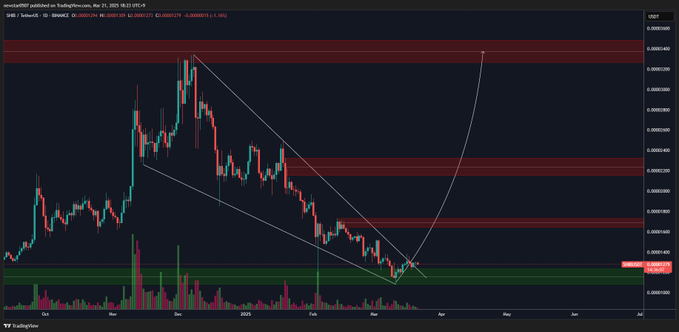
Shiba Inu Price Breaks Falling Wedge: Key Levels To Watch

Shiba Inu (SHIB) has formed a falling wedge pattern on the 4-hour chart, a technical signal that often indicates a bullish reversal. After an extended consolidation period, SHIB is now approaching key resistance levels that could determine the next direction of the price.
Technical Analysis and Key Levels to Watch
Currently, SHIB is trading around $0.0000132. The first resistance level to watch is $0.000014, which corresponds to the 26-day EMA. If SHIB breaks above this level, the next target would be the 50-day EMA around $0.00001527. A successful break of these resistance levels could pave the way for SHIB to reach $0.000034, as some analysts have predicted.
On the contrary, if SHIB fails to sustain above these resistance levels, the price could drop to the important support level at $0.00001235. Holding this support level will be crucial to sustain the potential uptrend.

Trading Volume and Market Sentiment
The recent increase in trading volume indicates strong interest from large investors. However, the RSI is currently at 71.04, suggesting that SHIB may be in an overbought state, which could lead to a short-term price correction.
Conclusion
SHIB breaking out of the falling wedge pattern and breaking above important resistance levels would be a positive signal for the uptrend. However, investors should closely monitor trading volume and other technical indicators to assess the strength of the trend. As always, investing in cryptocurrencies involves a number of risks, and it is important to conduct thorough research before making a decision.
